Using Statistics
What Does It Do?
The Statistics tool in Courses allows professors and teaching assistants to view usage statistics for the class site.
How You Can Use It
- See an overview of which tools students are actively using.
- Determine which students are using the tools the most/least.
- Find out if a student has viewed the syllabus.
- Generate usage reports that can be exported to other formats.
Instructions
Creating a custom report is easy.
- Click the tab for the course or project site.
- Click Statistics in the left menu.

- Click Reports.

- Click Add.

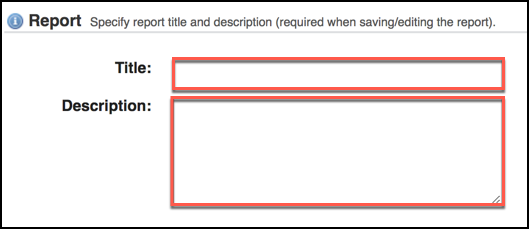
- (Optional) If you plan to save the report for future use, specify a Title and Description
in the appropriate fields.

- Under the "What?" category, select a report activity type:
- Visits: When did participants access the course site?
- Events: When and what did participants do in the course site?
- Resources: Which resources did participants access and when?
- Under the "When?" category, select a time period for the report:
- All
- Last 7 Days
- Last 30 Days
- Last 365 Days
- Custom (a specific date range)
- Under the "Who?" category, select which participants to include in the report:
- All
- Role (e.g. student, teaching assistant, instructor; access, assist, maintain)
- Group (display data involving participants unique to a previously created group)
- Custom (select a specific user or several users)
- None
- Under the "How?" category, select the elements (columns) to include in the report.
Note: some of the options are available only for specific report types (see step #6
above). Tip: you can also hold the CTRL key (CMD key for Mac) to select multiple
elements:
- User
- Tool
- Event
- Resource
- Resource Action
- Date
- (Optional) If you would like to limit the number of results in your report, you may mark the check box and enter a maximum number of results.
- In the "Presentation" field, choose to display your report in the form of a table, chart, or both.
- If you wish to save this report for future viewing, click "Save report." Otherwise,
click "Generate report" to view the output immediately.

- (Optional) If you wish to export the report, click "Export" at the bottom of the generated
report and then select one of the three prompted Excel options:
- Export XLS
- Export CSV
- Export PDF
Example Reports
"All visits, all users, last 365 days"
Want to see if someone visited your site on the day when an assignment was due? This custom report will verify whether they accessed your site or not.
- What: Visits
- When: Last 365 days
- Who: All
- How: User, Event, Date
"All events, all users, last 365 days"
Want to know if they ever viewed your syllabus, visited the Tests & Quizzes tool, or interacted with other tools? This is the report to create.
- What: Events (Select by tool, All)
- When: Last 365 days
- Users: All
- How: User, Tool, Event, Date
"All resources, all users, last 365 days"
Want to know what documents or web links they've accessed in Resources, Dropbox, etc.? Try this custom report.
- What: Resources
- When: Last 365 days
- Users: All
- How: User, Resource, Resource action, Date
We encourage you to experiment with the Statistics tool to help you review the engagement level of your students and which materials or tools are the most popular in your course site.